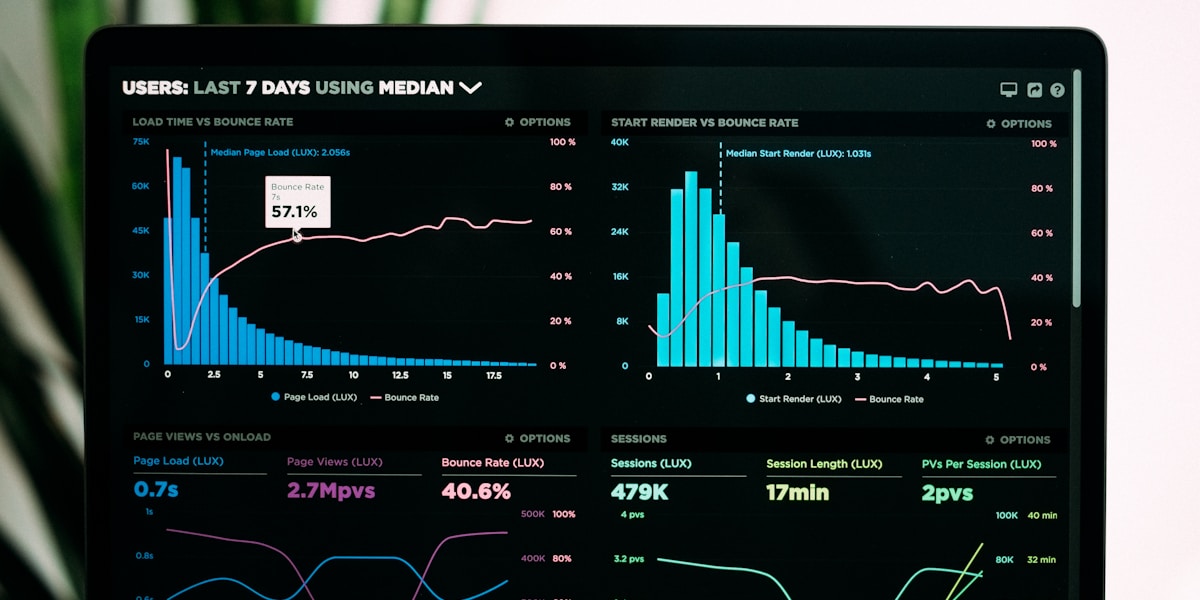
Many SMEs make decisions by opening several tools at once: the CRM to see opportunities, invoicing software to review revenue, Google Analytics to check traffic, a spreadsheet to control campaigns and the bank to confirm payments. The data exists, but it is scattered. As a result, management spends time collecting information and, by the time it is finally together, it may already be late.
Automatic dashboards and KPIs help the business see more clearly. The goal is not to fill a screen with attractive charts, but to bring the important indicators into one reliable, updated and understandable place. If a metric does not help someone decide, it probably does not deserve space.
The problem with checking data in five tabs
When each area works in its own tool, the company ends up comparing data that does not always speak the same language. Marketing measures leads, sales measures opportunities, administration measures invoices and operations measures pending tasks. Everyone may be right, and still the business may lack a complete view.
Manual errors also appear. Someone exports a CSV, copies columns, changes dates and prepares a report every Friday. That work takes hours and a formula, filter or old version can easily change the reading of the business.
What a good dashboard should measure
A useful dashboard starts with specific questions. How many leads are coming in? Where do they come from? How many turn into meetings, quotes and sales? Which invoices are pending? Which projects are delayed? Not every SME needs the same KPIs, but every business needs indicators that connect activity with results.
- Sales: new leads, open opportunities, closing rate and expected value.
- Marketing: traffic, forms, active campaigns and cost per contact.
- Operations: active projects, blocked tasks, delivery times and team workload.
- Finance: revenue, pending payments, recurring income and cash-flow forecast.
- Customer support: open tickets, response times and recurring issues.
Automating data collection
The key is not only designing the panel, but feeding it without depending on manual work. The dashboard can connect with the CRM, website, invoicing, calendar, support tools, advertising campaigns and spreadsheets. Each source contributes a part, but the company should define which data wins when figures differ.
Update frequency matters too. Some metrics need a daily refresh; others are enough weekly or monthly. Forcing real time everywhere can make the system more complex without adding value. What matters is having the data available when a decision is due.
AI helps explain what changed
A dashboard shows numbers, but AI can help detect patterns and summarise changes. For example, it can warn that leads have increased while the closing rate has dropped, that a campaign brings low-quality contacts or that pending payments are growing in a specific customer type.
That analysis does not replace business judgement, but it avoids reviewing every chart from scratch. When configured well, AI can prepare a weekly summary with relevant changes, possible causes and questions worth discussing in the management meeting.
Starting small avoids useless panels
The common mistake is trying to measure everything on day one. It is better to start with a simple dashboard for one important process: lead generation, invoicing, projects or support. Then the company can validate whether the data is reliable, whether the team uses it and whether decisions improve.
Later, new sources, automatic alerts, period comparisons and targets can be added. A good dashboard is not a static report; it evolves with the business.
At Bertronit, we help SMEs create automatic dashboards and KPIs by connecting websites, CRM, invoicing, campaigns and internal tools. If you want to see the real state of your business without opening five tabs or preparing reports by hand, contact Bertronit and we will review which indicators are worth automating first.